Nafas Airwrapped: A Recap of your 2021 Air Quality
And just like that, we are at the end of 2021. The new year has brought a lot of fat macarons, viral sandwiches, and more lockdowns. But nafas is here to bring you a flashback on the air quality around you throughout 2021. How bad (or good) was it? Where do you stand in the overall rankings? All the answers are available in Nafas Airwrapped 2021. Here’s a quick low down on what we’ve observed from the data:
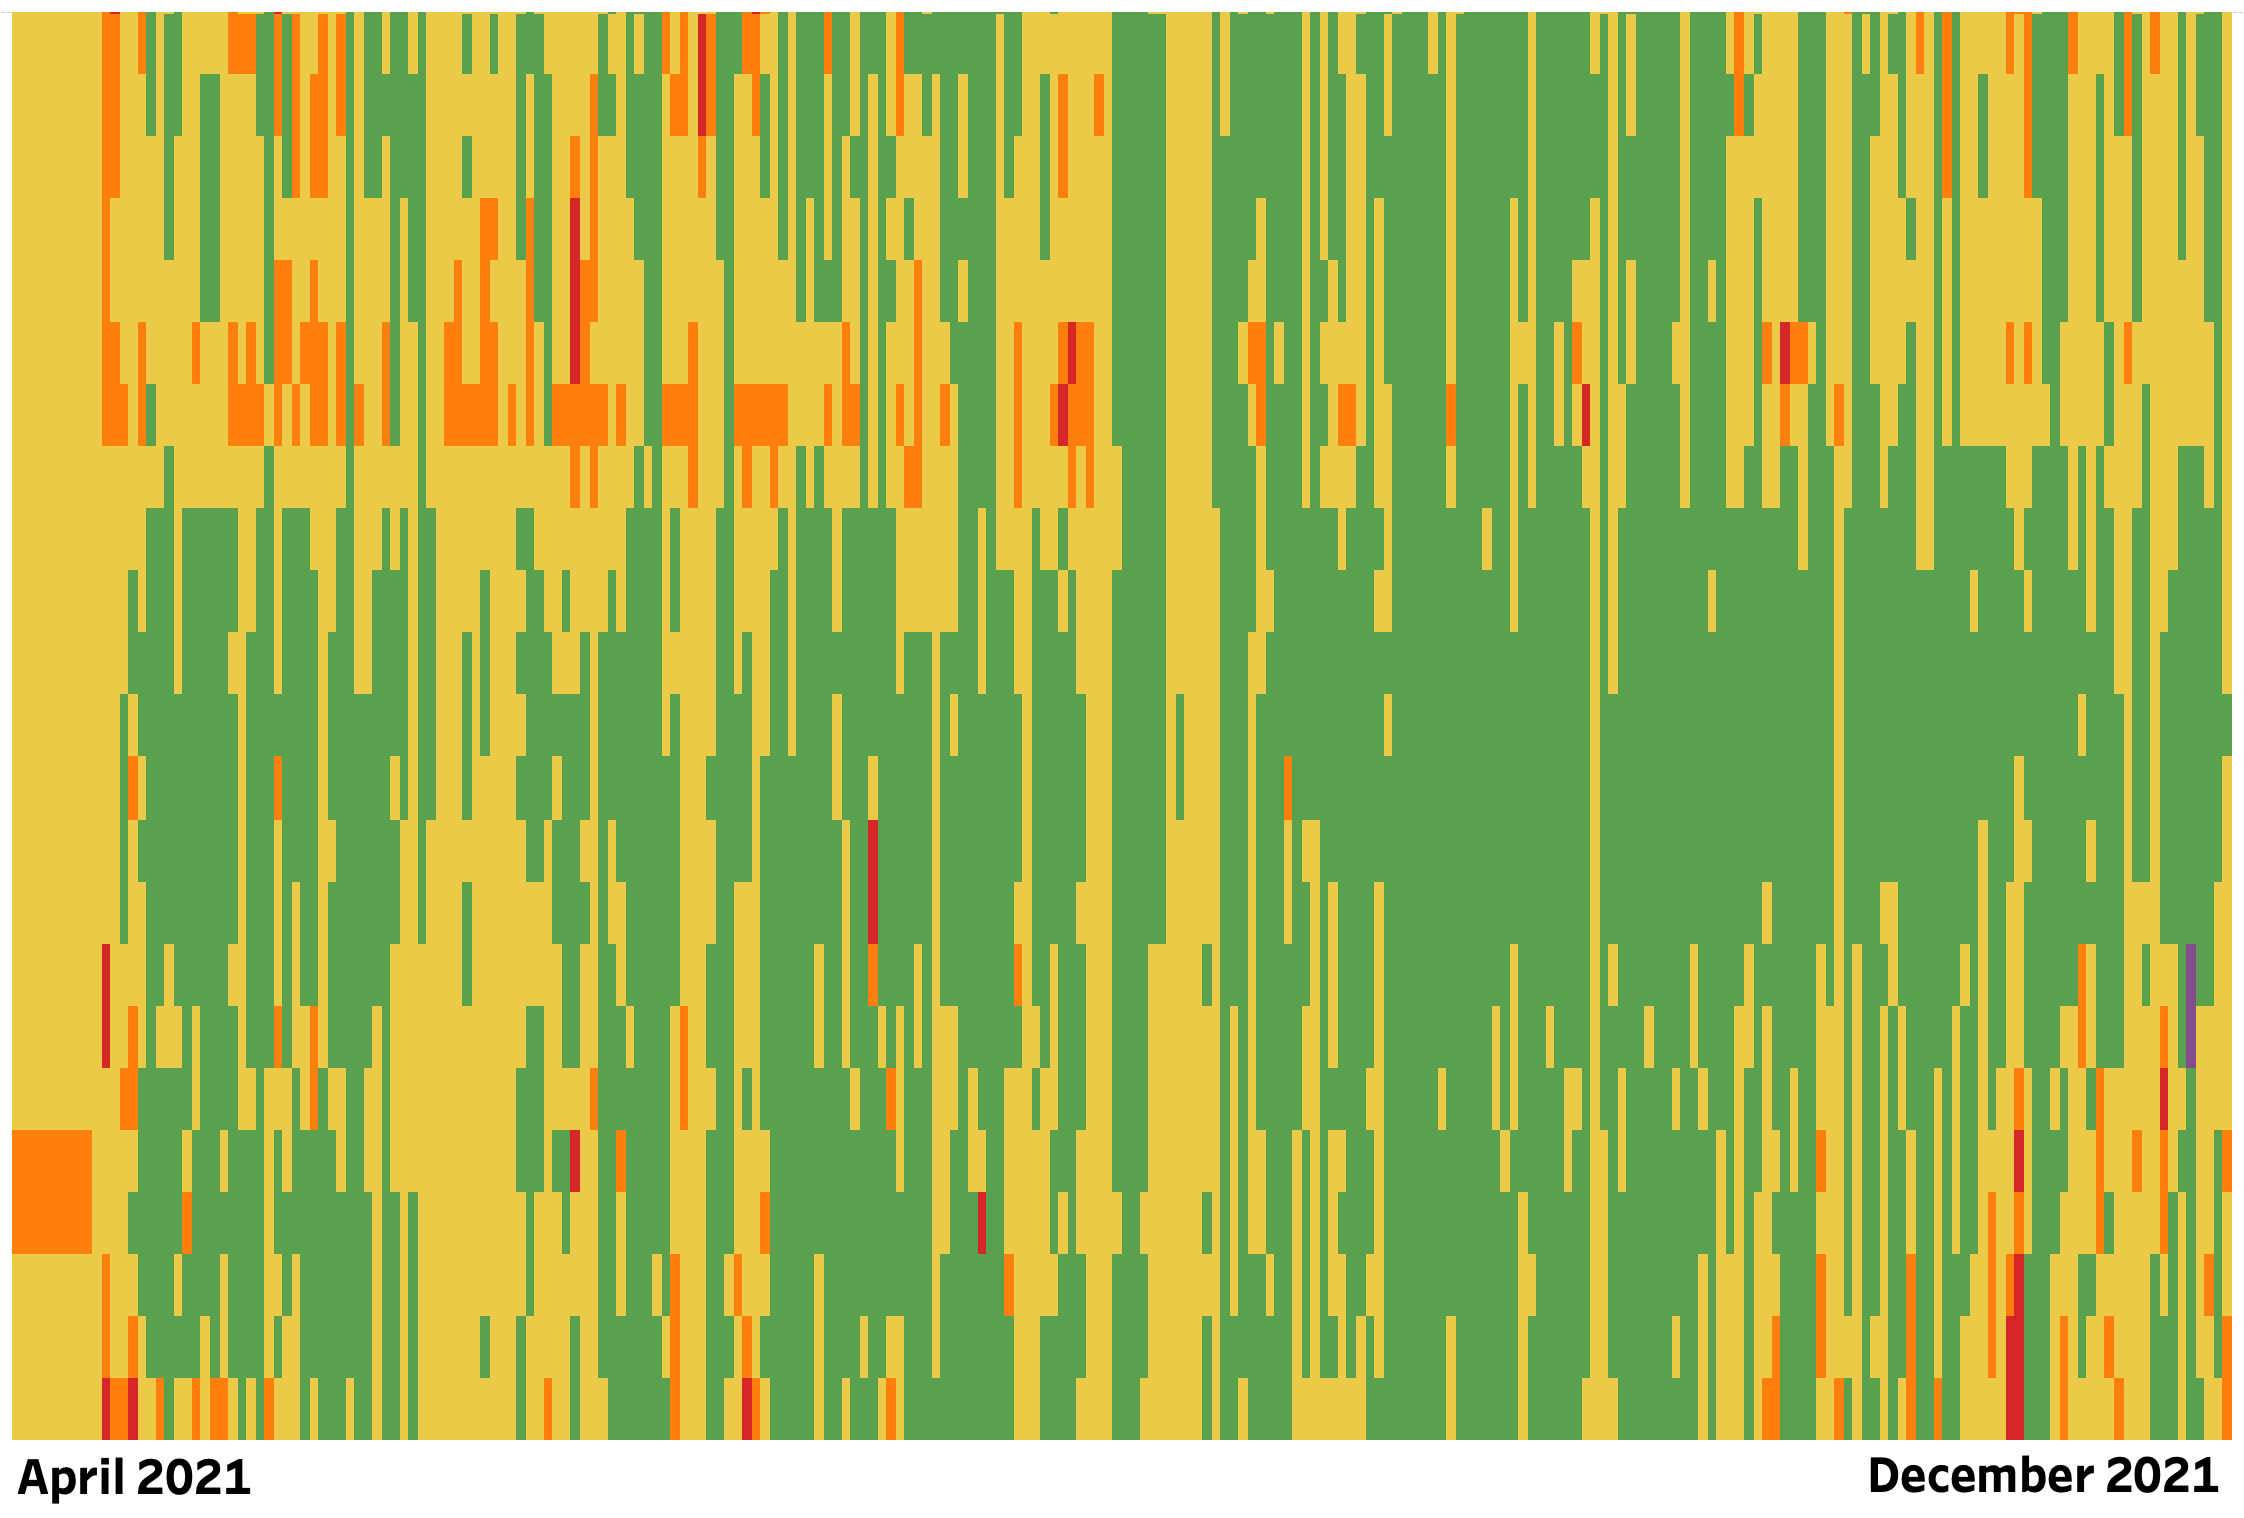
The Good: Sanur, Bali. Throughout the year, Bali barely encountered any bad air days. Maybe working from Bali really is worth it, huh?
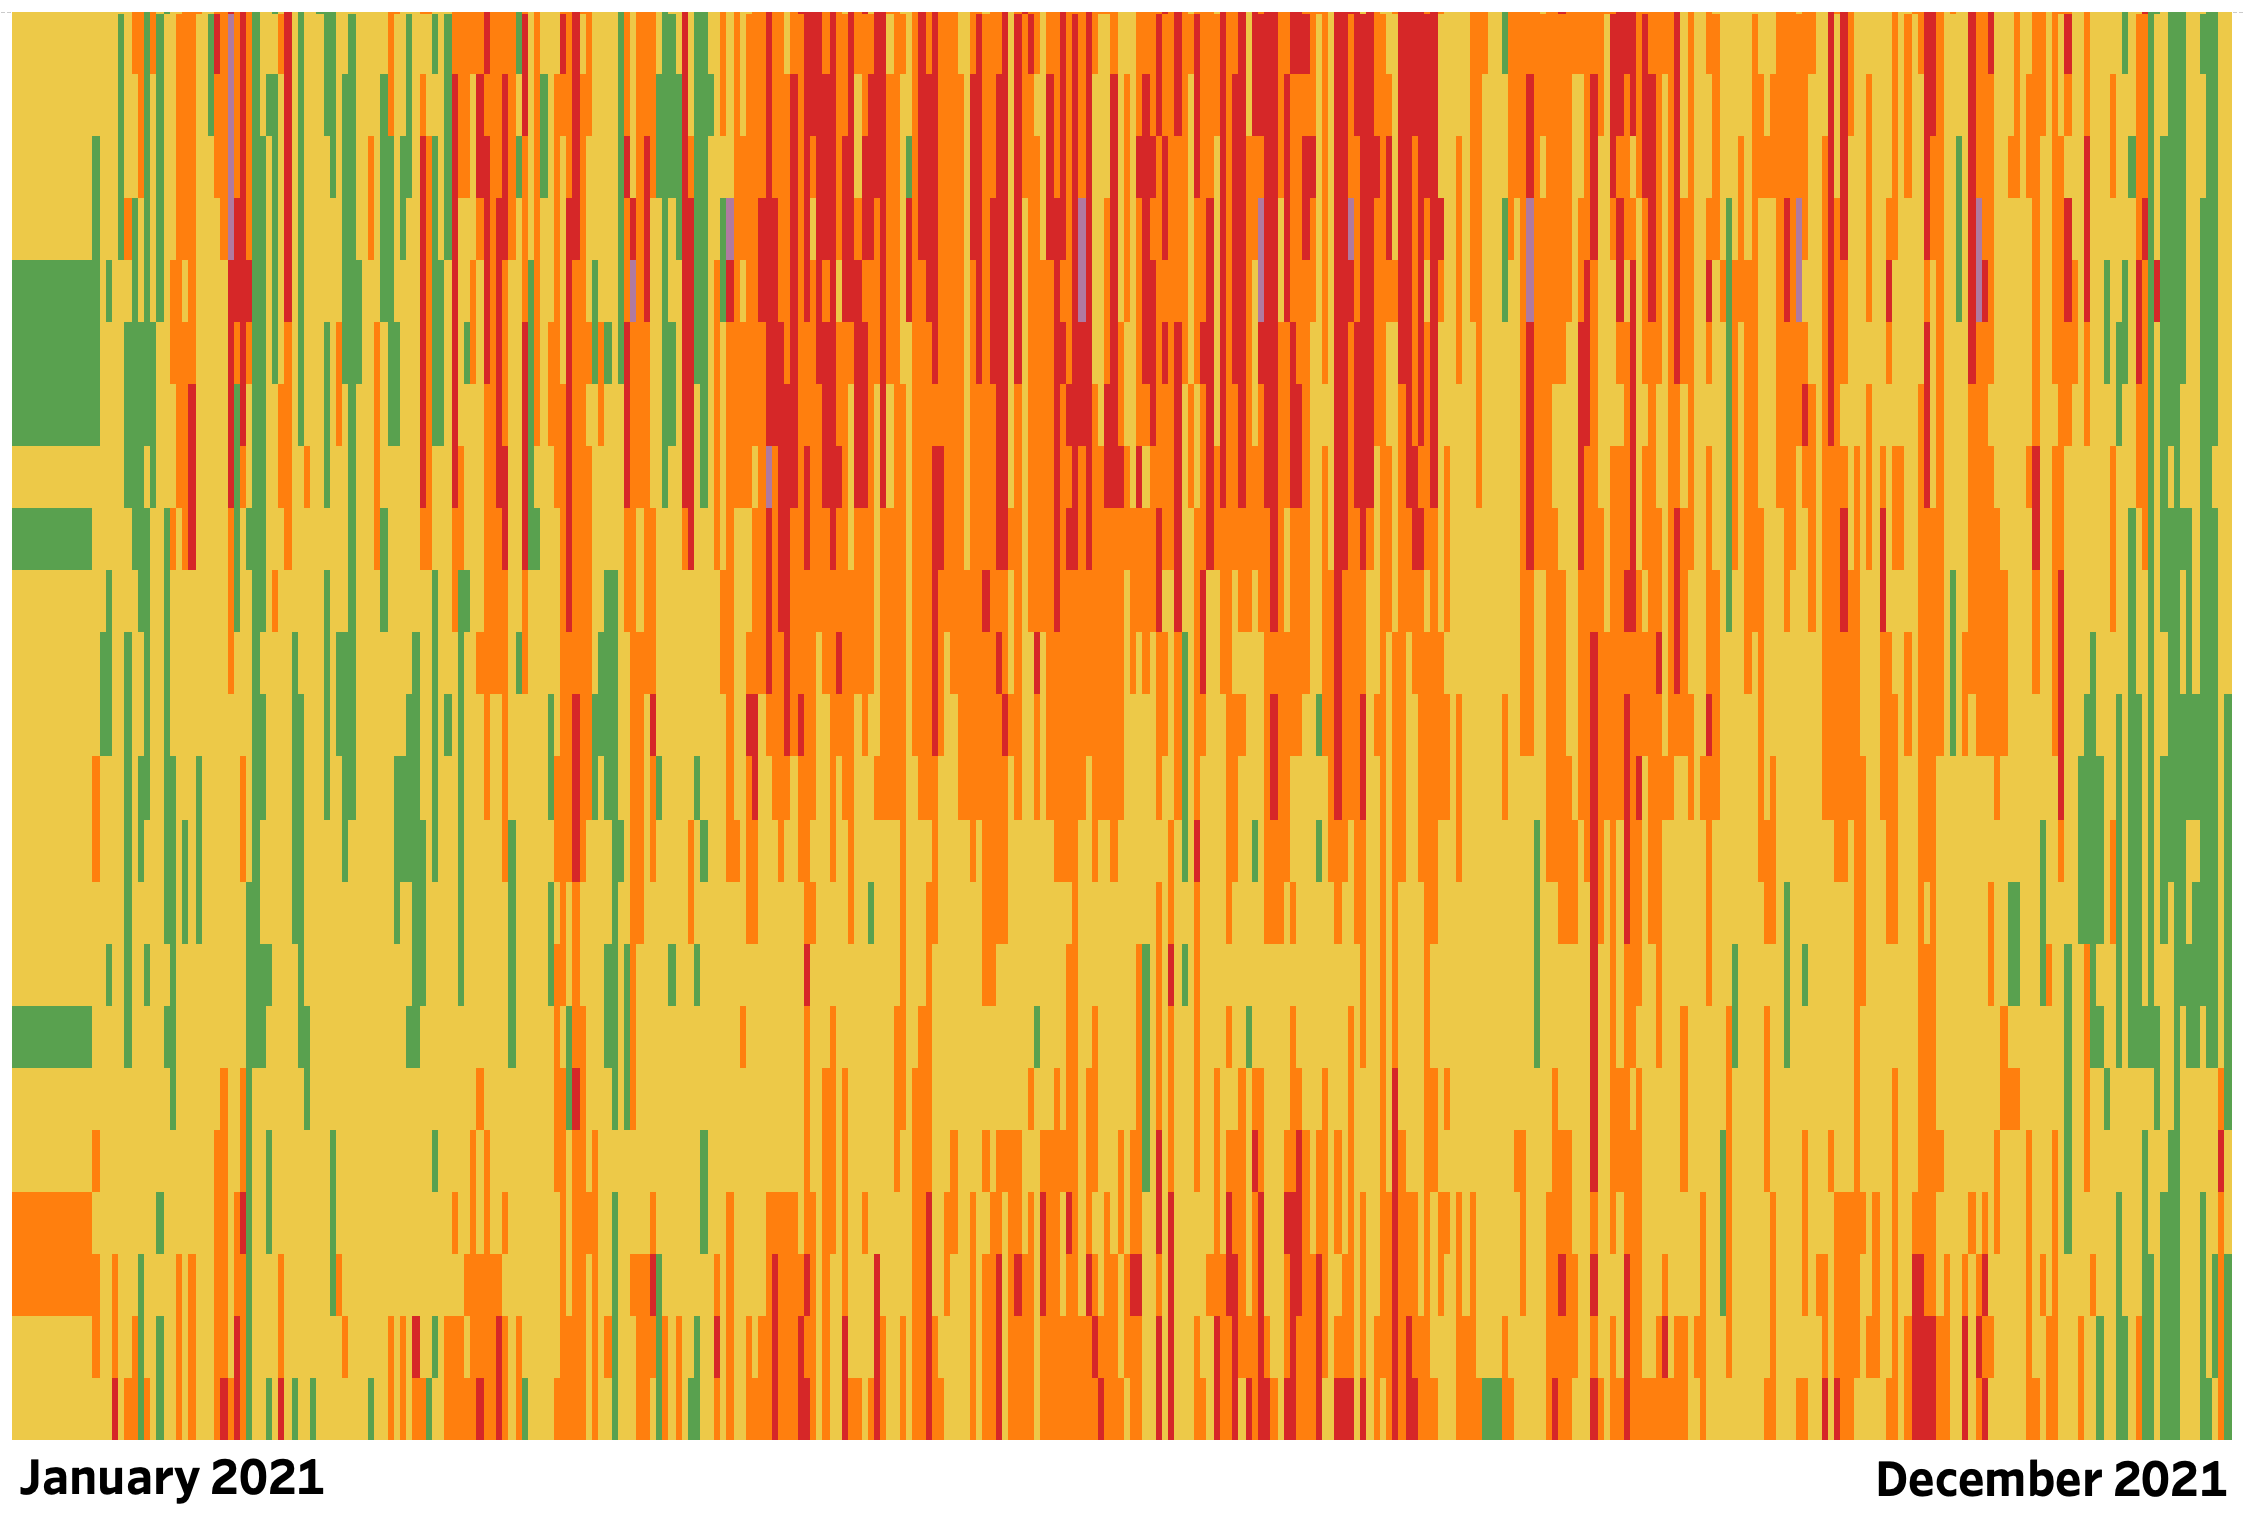
The OK: Kuningan, Jakarta Pusat. To the surprise of many in our team and perhaps most of you reading this, air quality in the middle of the city is not as bad one as we think it is.
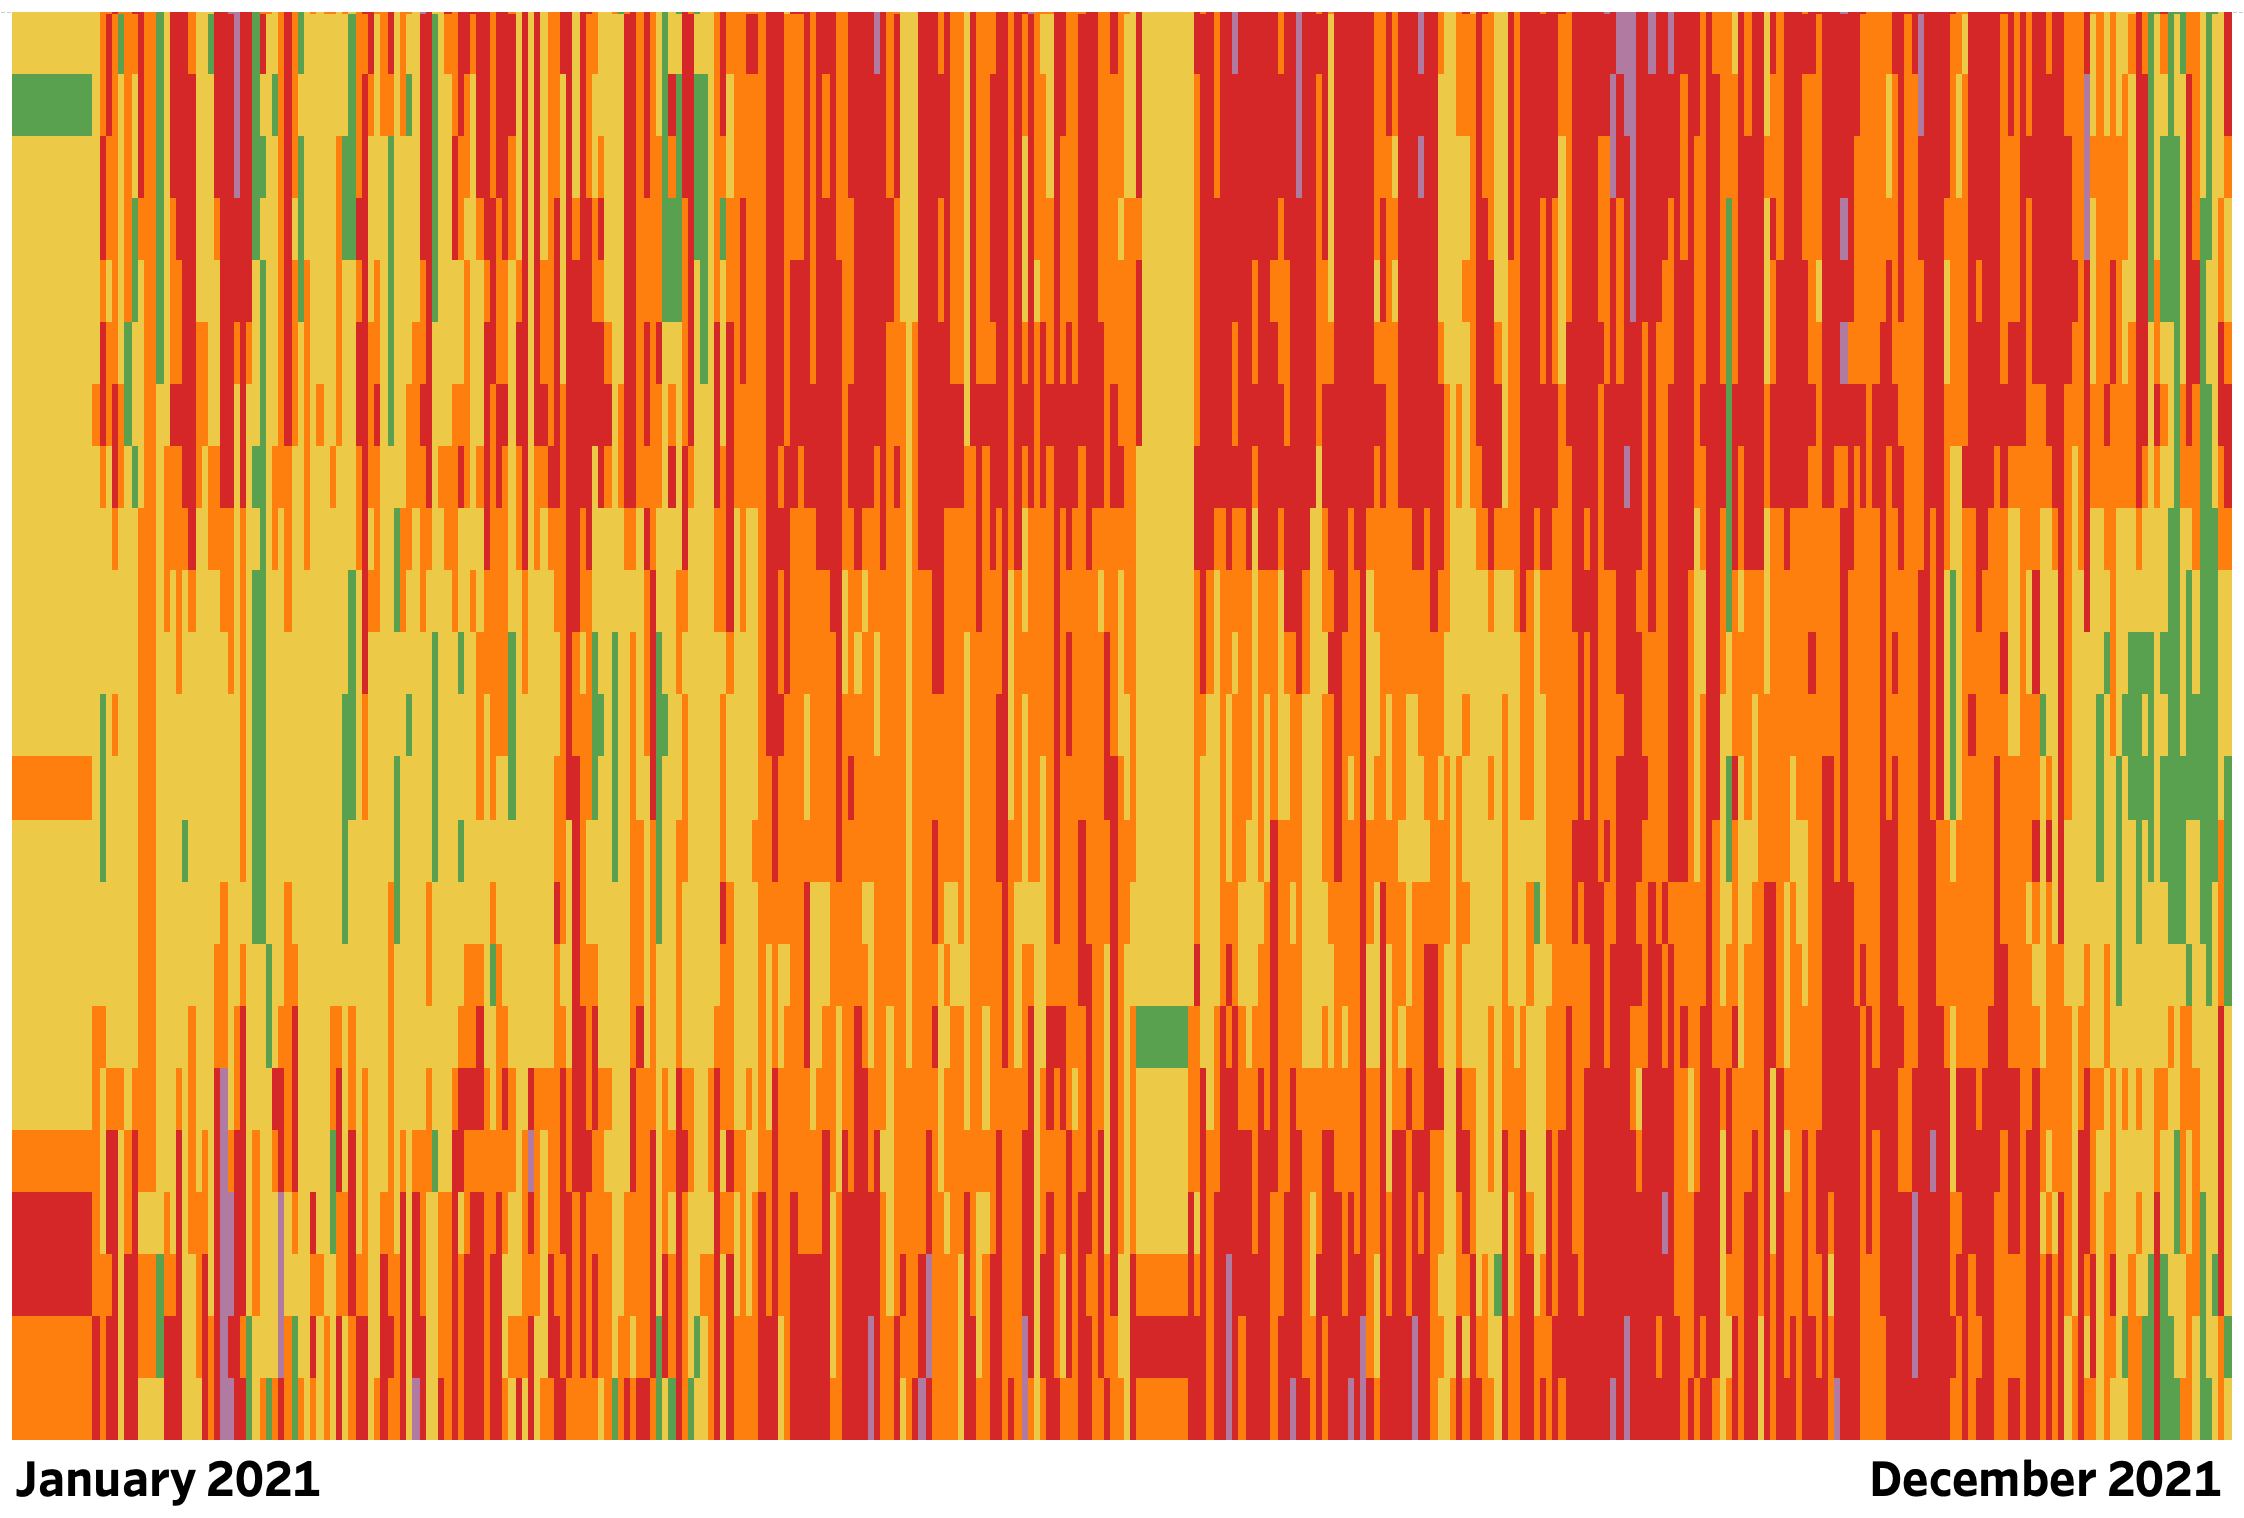
The Bad: BSD, Tangerang Selatan. The data from BSD proves just how air pollution does not discriminate against big cities or suburban areas.
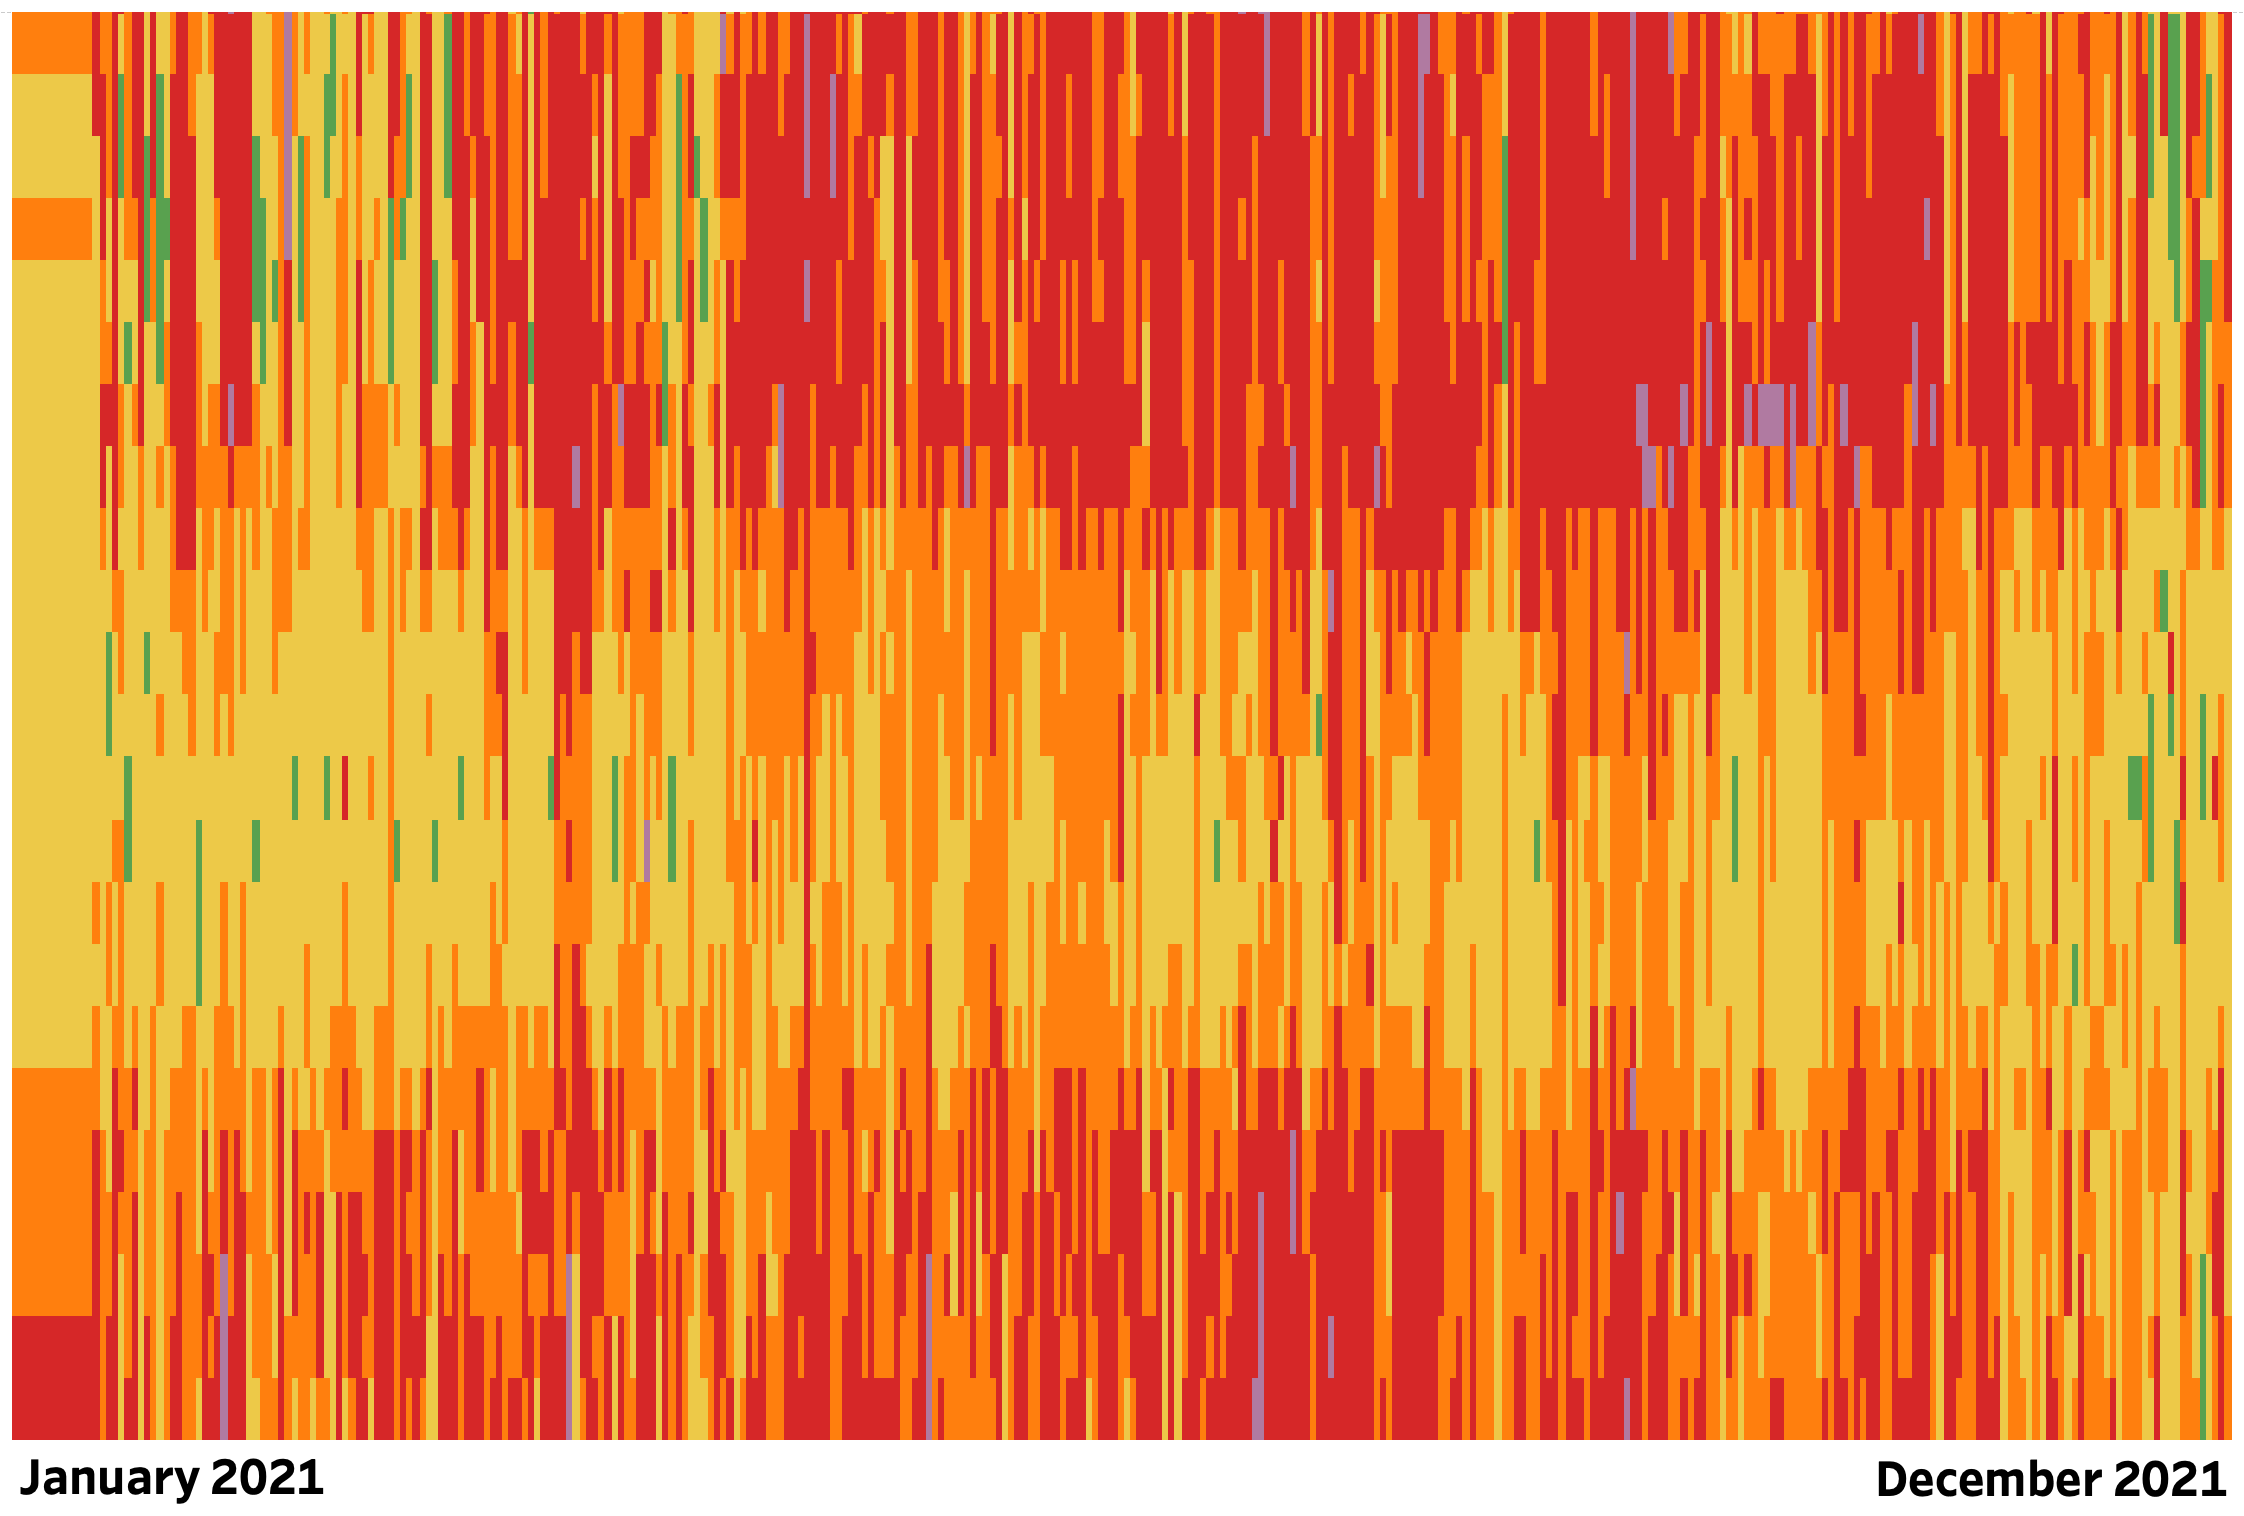
The Ugly: Mekarsari, Bogor. When air pollution from various sources become excessive, trees and all kinds of greenery won’t be able to help filter the pollution. Locations like Mekarsari, among others, have helped nafas debunk the myth that green is not always clean.
Now you might be thinking:
How can I read and understand Nafas Airwrapped?
It’s simple, remember the AQI chart? If you check nafas daily, you should be fluent by now. But here’s the AQI cheat sheet.
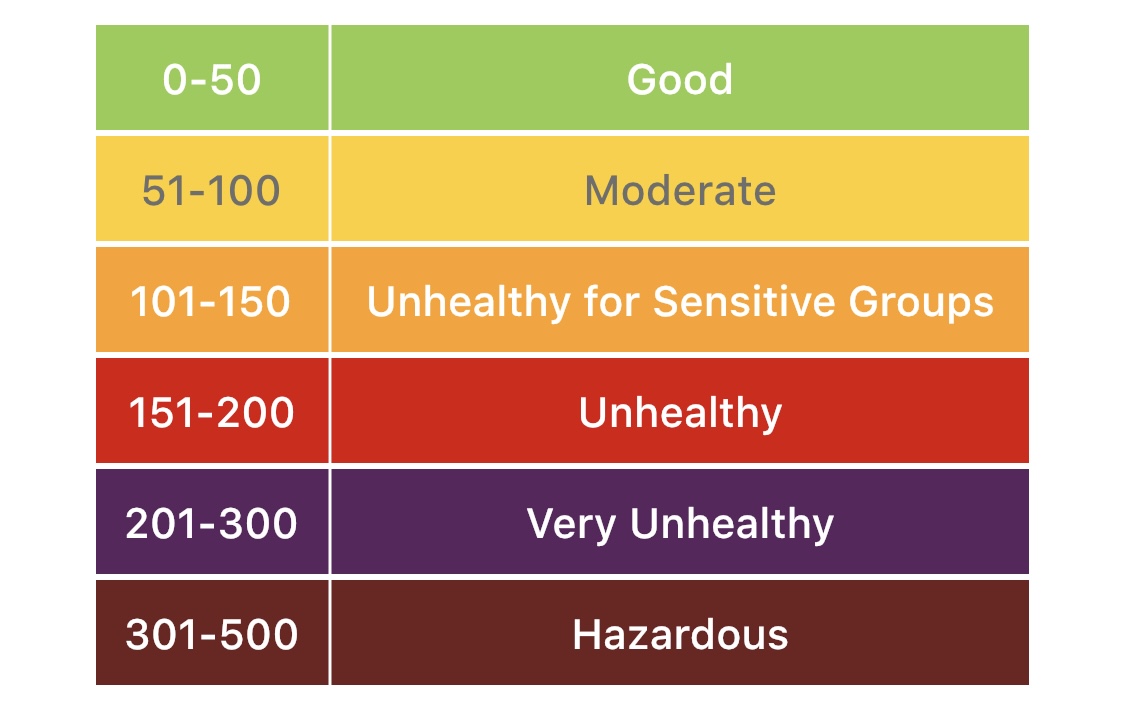
Each color represents the level of air quality on a certain day for 24 hours from the beginning of 2021 until early December of this year. Our team calls it the pizza chart, because it reminds everyone of pizza toppings for some weird reason.
So, don’t forget to update your app, pick your favorite locations, and check your own Nafas Airwrapped 2021 here. Share and compare your results with everyone around you!